Population* |
3 mile | 5 mile | 10 mile | Drive Time < 20 minutes |
| 2012 Population by Single Race Classification | ||||
| White Alone | 78.3% | 81.7% | 87.3% | 87.1% |
| Black or African American | 11.1% | 9.2% | 5.7% | 5.8% |
| American Indian | 0.4% | 0.4% | 0.3% | 0.3% |
| Asian Alone | 1.9% | 1.8% | 1.7% | 1.6% |
| Some Other Race Alone | 3.9% | 3.2% | 2.2% | 2.2% |
| Two or More Races Alone | 4.3% | 3.7% | 2.8% | 3.0% |
| Hispanic or Latino Alone | 10.9% | 9.2% | 6.9% | 7.2% |
| 2012 Population by Age | ||||
| Age 0-9 | 11.6% | 11.1% | 10.2% | 10.3% |
| Age 10-14 | 5.7% | 5.6% | 5.7% | 5.6% |
| Age 15-24 | 12.2% | 11.9% | 13.0% | 12.9% |
| Age 25-34 | 12.7% | 12.0% | 10.4% | 10.8% |
| Age 35-44 | 12.2% | 12.1% | 12.1% | 12.3% |
| Age 45-54 | 15.8% | 16.2% | 16.6% | 16.4% |
| Age 55-64 | 13.2% | 13.8% | 14.7% | 14.6% |
| Age 65+ | 16.7% | 17.3% | 17.2% | 17.3% |
| Total | 34,068 | 45,813 | 96,451 | 86,823 |
| 2012 Population by Sex | ||||
| Male | 16,359 | 22,014 | 46,440 | 41,786 |
| Female | 17,709 | 23,798 | 50,011 | 45,037 |
| 2012 Average Age | 41.4 | 42.9 | 43.9 | 43.7 |
| Number of Households (2012 Estimate) | 14,394 | 18,946 | 39,237 | 35,730 |
| 2010 Average Household Size | 2.28 | 2.30 | 2.32 | 2.31 |
| 2012 Median Household Income | $45,729 | $50,383 | $56,505 | $54,230 |
| 2012 Median Owner Occupied Housing Values | $165,952 | $170,364 | $194,611 | $187,862 |
*Source: U.S. Census Bureau, Census 2010 Summary File 1. Esri forecasts for 2012. Esri converted Census 2000 data into 2010 geography.
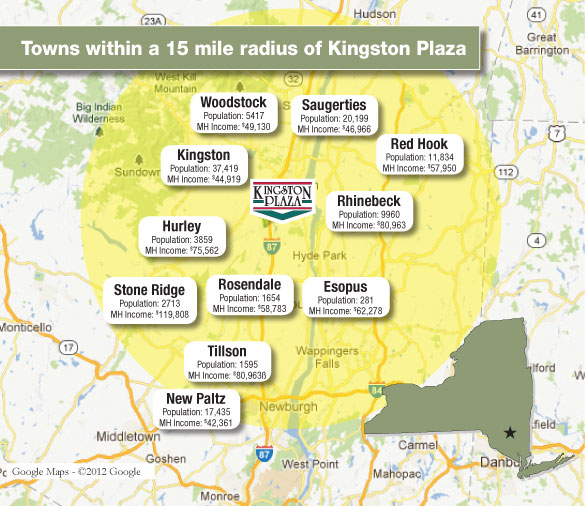
The Closest Stop Will Be Your Customer’s First Stop
| City | Zip Code | Median Household Income | Distance to Kingston | Distance to nearest Shopping |
| Stone Ridge | 12484 | $119,808.00 | 8.5 | 13.1 |
| Tillson | 12486 | $80,963.00 | 9.4 | 14.7 |
| Hurley | 12443 | $75,562.00 | 2.9 | 7.1 |
| Esopus | 12429 | $62,278.00 | 9.1 | 10.4 |
| Port Ewen | 12466 | $60,720.00 | 3.7 | 4.9 |
| Bloomington | 12411 | $60,694.00 | 5.4 | 10.6 |
| West Hurley | 12491 | $60,279.00 | 7.1 | 9.7 |
| Rosendale | 12472 | $58,783.00 | 8.4 | 13.7 |
| Woodstock | 12498 | $49,130.00 | 10.4 | 13.8 |
| Shokan | 12491 | $47,144.00 | 13.2 | 16.6 |
| Saugerties | 12477 | $46,966.00 | 13.2 | 9 |
| Kingston | 12401 | $44,919.00 | 1.0 | 3.4 |
| New Paltz | 12561 | $42,361.00 | 15.0 | 22.6 |
| High Falls | 12440 | $38,964.00 | 11.6 | 16.3 |
*Source: 2012 www.city-data.com. Sorted by median income.